3.6. Kernel density
A useful tool to visualize the density of a point layer it is the Heatmap. In QGIS, we can directly use a styling option of the layer.
- Right-click the
places_cliplayer on the Layers panel- Select Properties
- In the menu on the left, select “Symbology”
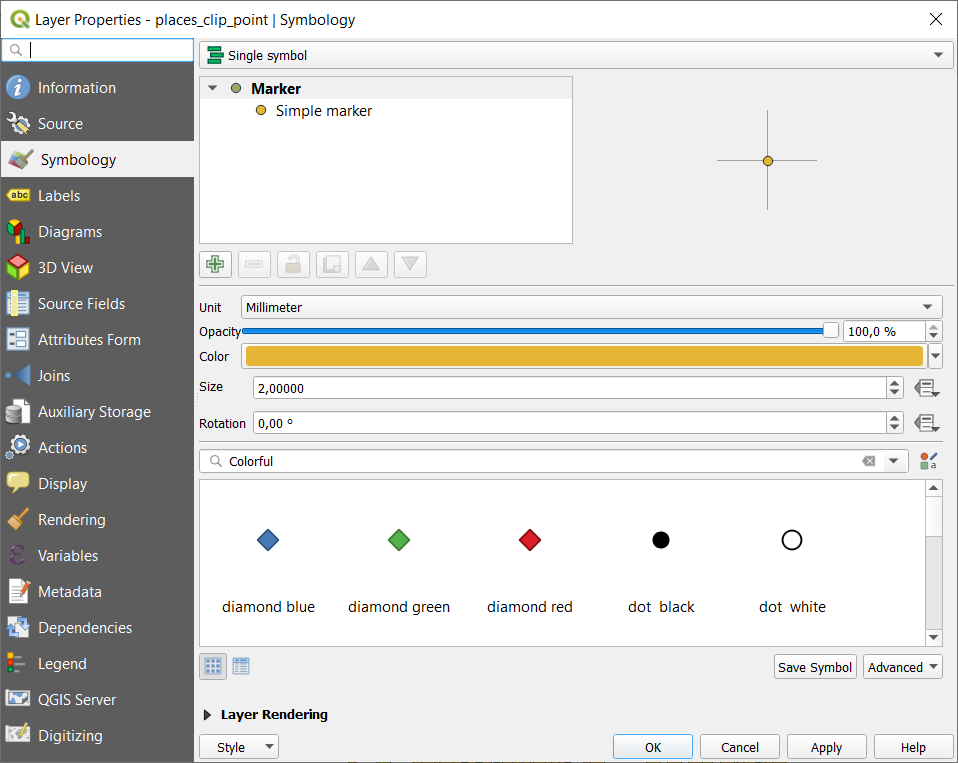
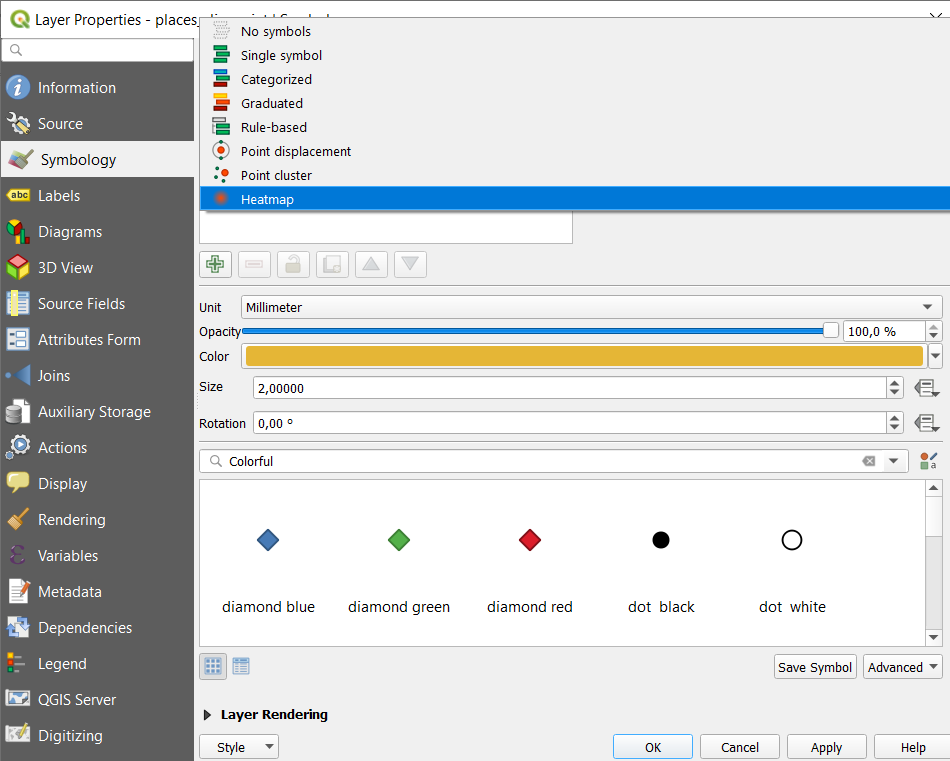
- In the dropdown menu on top, select Heatmap
Now you only have to choose the parameters:
- Color ramp: reds
- Radius and radius unit of measure: 10 millimetres
- Maximum value (leave Automatic)
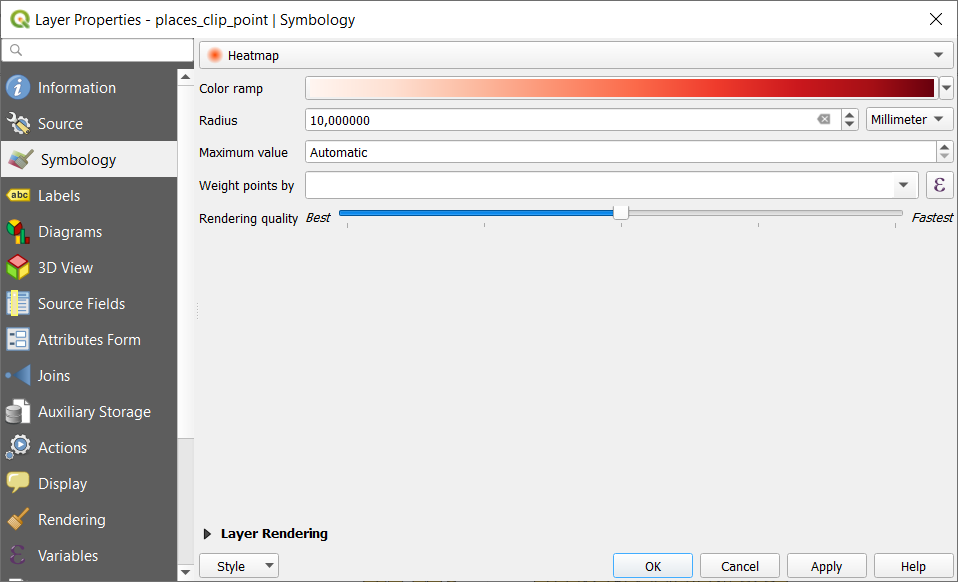
- Then click OK button on the bottom
The result is the visualization of the places layer as a heatmap:
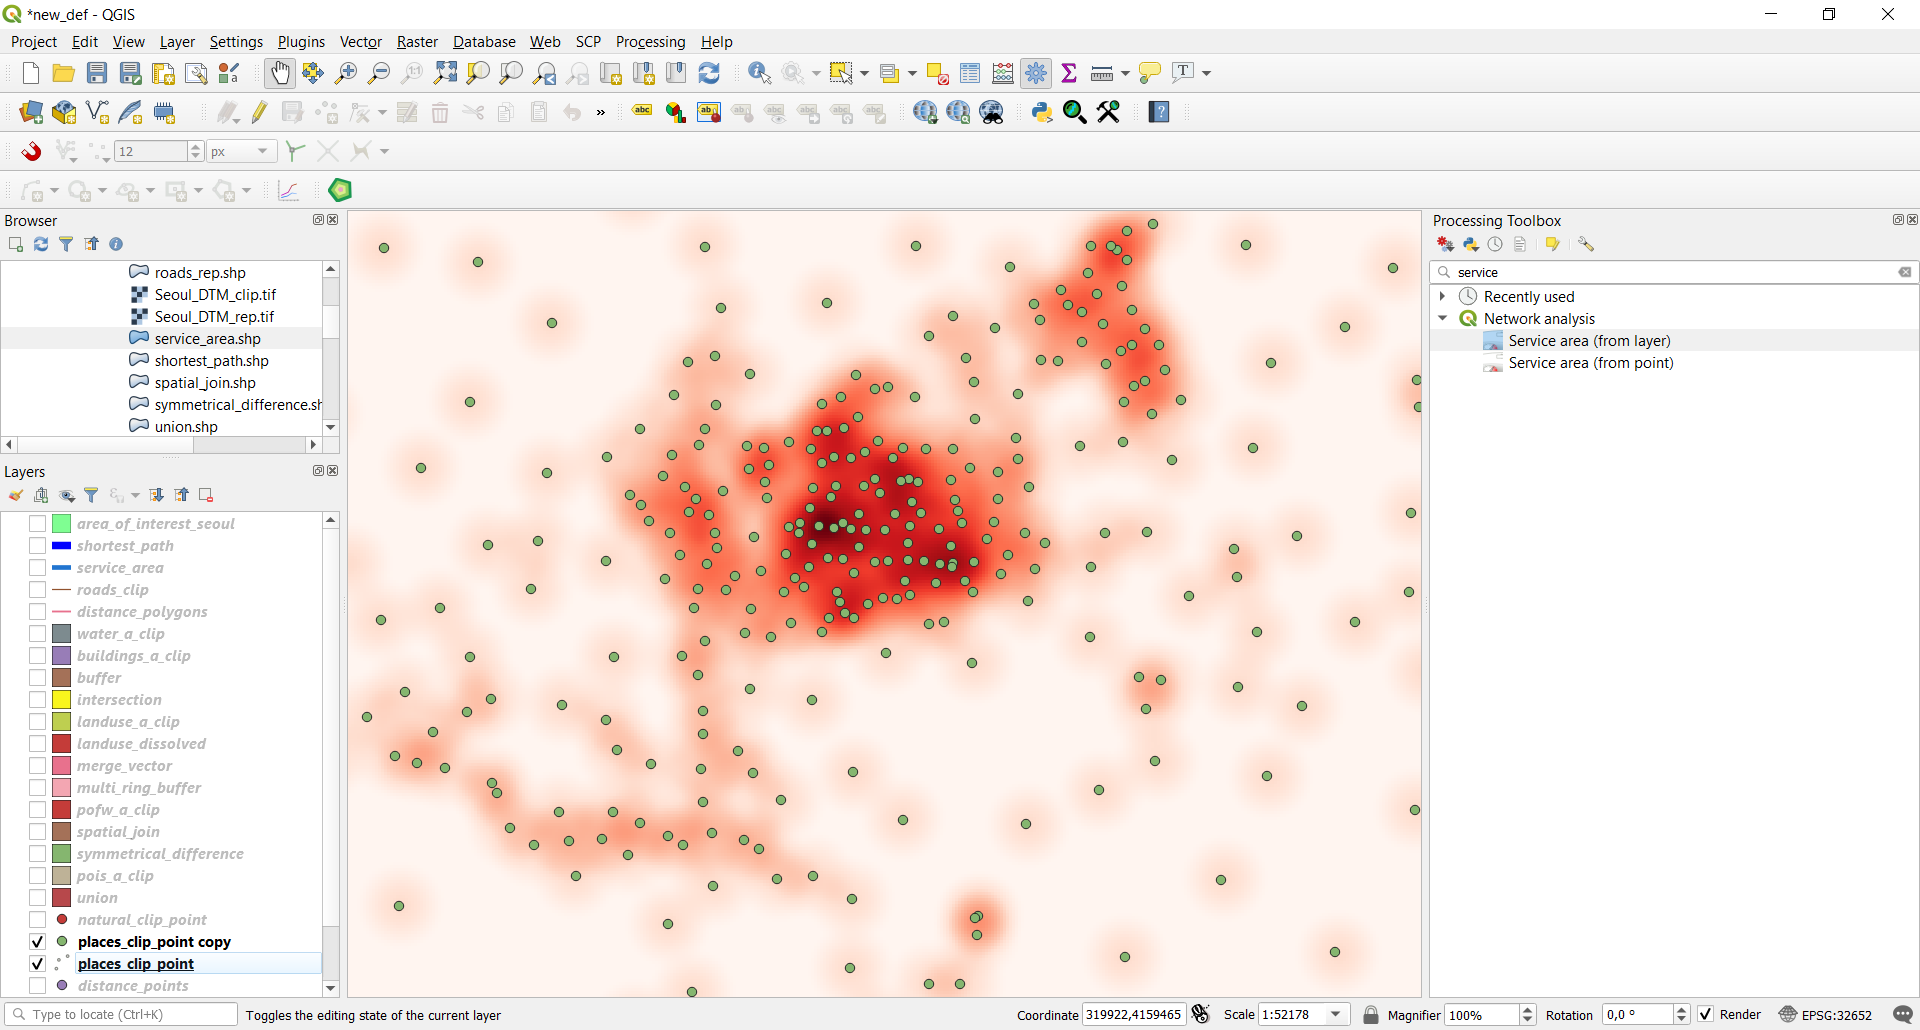
Fig. 3.6.1 Comparison between the heatmap and a copy of the
places_cliplayer with the point symbology